[NOTE: Almost the exact same article can be written for Baylor, except that Baylor hasn’t played any tough games, and as a result are undefeated. But I wanted to choose just one team to refer to throughout. So, Baylor fans, just Ctrl+H and replace “Michigan State”/”Tom Izzo” with “Baylor”/”Scott Drew”.]
A 6-3 record against a tough schedule certainly isn’t the end of the world, and as The Only Colors pointed out, the Spartans have had plenty of success in the postseason after slow November/December starts. But Michigan State was ranked #2 in the preseason AP poll, and the team is clearly struggling more than expected. Taking a look at their stats page on kenpom.com, what jumps out are the big red splotches on the left: they’re ranked 322nd nationally in Turnover%, 293rd in FT%, and 298th in Steal%. But what are those marks costing Tom Izzo’s team? Quite a lot of offense, it turns out.
TURNOVERS/STEALS
One way to gauge the effect of turnovers is to look at what happens when a team doesn’t turn the ball over. To calculate a team’s offensive efficiency on possessions where they managed to hang on to the ball (TOAdjOff), I used a simple formula:
TOAdjOff = Adjusted Offensive Efficiency / (1 – Turnover%)
I then subtracted this from their actual adjusted offensive efficiency, to get what I’ll call turnover cost. It tells us how much a team’s adjusted offensive efficiency would increase if they somehow never turned it over. Here’s the top 20 in the country:
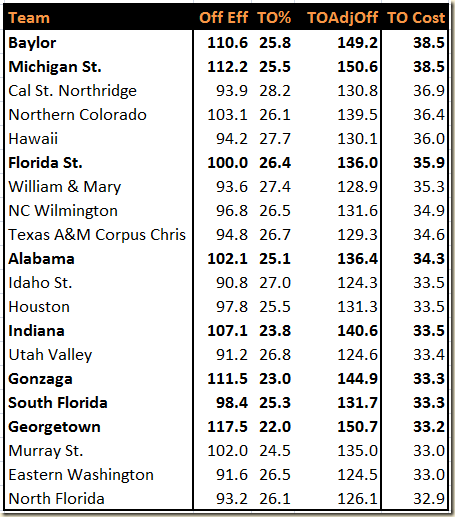
In case you’re wondering, that value of 150.6 for TOAdjOff is 3rd in the country, behind Duke and Georgetown. When the Spartans don’t turn it over, they’re among the best of the best.
Of course, a turnoverless team is a pipe dream; a more reasonable goal for the Spartans is to try to improve their TO% from abysmal to merely average. This seems doable – the average MSU TO% over the last 8 years has been 21.4%, which is right in line with this year’s national average of 21.2%. Using the same concept as above, but adjusting TO% to 21.2% instead of 0%, Michigan State ends up with an offensive efficiency of 118.7 (a gain of 6.5 over their current 112.2). That would bump their offensive rank from 26th to 4th, and their Pomeroy ranking from 14th to 5th. Couple that with what I can only assume would be a dip in opponent transition points, and they could rise even higher.
FREE THROWS
Michigan State is nearly as poor at free throw shooting as they are at preventing turnovers, but it’s not nearly as important because: A) a missed free throw only costs 1 point, while a wasted possession costs, as we saw above, 1.5 points; and B) there tends to be far fewer free throw attempts than possessions.
The Spartans have a 63.4 FT% so far, compared to a national average of 68.1%. Over their 202 FTA, that amounts to a difference of 9.6 total points. Working back from their number of possessions, that works out to 1.5 points per 100 possessions.
ALL TOGETHER NOW
If you add those 1.5 points onto the 6.5 gained from reducing turnovers, Michigan State’s offensive efficiency would rise to 120.2. However, because the gap between the top 4 teams (Duke, Kansas, Ohio State, and Pittsburgh) and the rest of the field is so large, their overall ranking wouldn’t change. Still, if Tom Izzo can tighten up (see also: tighten up) his leaky boat, he’ll have a good chance of floating down to Houston, come April.


 Posts
Posts


