Showing posts with label Kansas State. Show all posts

Tuesday, February 1, 2011

Defensive Score Sheet: Kansas State@Kansas

[As always, check out my first Project Defensive Score Sheet post for information on what this all mean. Also, shout out to Ray Floriani for taking a cue from by good/bad shots tracking, and doing it for St. Bonaventure.]

Sorry this is so late. I promise tonight’s game against Texas Tech will be up tomorrow. Here’s the table. My thoughts are after the break.

image

Tuesday, December 21, 2010

Mini-Preview: UNLV-Kansas State

[EDIT: After writing this, Jacob Pullen and Curtis Kelly were ruled ineligible fro Kansas State.  So, umm, never mind.  KSU is no longer a “good” offense, so UNLV should be fine.]

[This post is really just an excuse to use a spreadsheet I whipped up, which takes a year and a school as input, and automatically creates a chart like the one below.]

UNLV tips off against Kansas State in Kansas City a mere hour from now.  The Rebels started off the year with a bit of hype, and lived up to it at first, topping Pomeroy ratings #10 Wisconsin at home by 3, and blowing out some scrubs.  But they’ve stumbled over the last 10 days, following up a very understandable loss at #13 Louisville with a much less forgivable home loss to #100 UC Santa Barbara.  In truth, their problems started to show up 2 games previous to the Louisville loss, when they beat a poor Nevada (#202) team by only 12, but sometimes a W can have a lipstick-on-pig effect.

It’s clear that a 12-point win over #202 isn’t fantastic (Pomeroy had predicted UNLV by 18), but sometimes it’s hard to get a feel for exactly how good/bad a performance is.  We can use opponent ratings to shed some light on the issue by using Pomeroy’s efficiency prediction formula:

Predicted Offensive Efficiency = ([Team Adj Off] + HFA) * ([Opp Adj Def] + HFA) / [Lg Avg Eff]

For each game that a team has played, we can replace the predicted efficiency with the team’s actual raw efficiency in that game, plug in their opponent’s rating, the league average rating, and the appropriate home field advantage (+/- 1.4% for each team, in a normal H/A situation) , and solve for [Team Adj Off].  That gives us the team’s single game adjusted offensive efficiency rating – essentially, this is how efficient a team would have been if they played exactly the same, but were facing an average opponent on a neutral court.  We can do the same for defense, and from those two numbers we can calculate the efficiency margin (which I find more intuitive to use) or Pythagorean rating (which Pomeroy uses to rank teams).  As a last step, we can take the single game Pythagorean rating, pretend that’s how the team has played the whole year, and see where they would rank in the Pomeroy ratings.  That allows us to say, for example, UNLV played like the #232 team in their loss to UC Santa Barbara.  The chart below shows this “played like” rank for each of UNLV’s games so far. (It also shows, from left to right, the location, opponent, opponent ratings, raw game efficiencies, and adjusted game efficiency ratings.)

 image

You can see that UNLV played great through the first 7 games, and then has really struggled over the last 5.  They’re still rated #22 by Pomeroy, but taking a close look at the individual game adjusted ratings reveals something interesting.  Their overall defensive rating so far is 89.7, but that’s largely because of ridiculous defense in a few games against poor offensive teams.  Here are the teams they’ve managed to post a sub-90 defensive rating against so far, along with those teams’ offensive ratings (keep in mind, average is 100):

  • UC Riverside (90.6)
  • SE Louisiana (91.7)
  • Illinois State (97.1)
  • Southern Utah (90.9)

That’s it.  Their 30th ranked defensive rating comes in large part from really cranking the screws on the little guys.  If they want to compete in the Mountain West this year, that’s going to have to change.  And if they want to win their semi-road game tonight against Kansas State (offensive rating of 106.7), that’s going to have to change.  I’m not saying it definitely won’t, but I’d say KSU has a better chance than UNLV of bettering their Pomeroy prediction (KSU by 1) tonight.

Saturday, March 27, 2010

Similarity Predictions: Elite 8

Figured I should get these up before the games start this afternoon.

image

As I mentioned in the KSU-Butler preview, I think the prediction for that game is skewed by the early season numbers.  Butler’s playing better than they were then.  If I look at only games from this calendar year, then the Similarity prediction pretty much agrees with Pomeroy and Vegas.

I should get a Duke-Baylor preview done this afternoon, and get it posted here and at UFR.

Friday, March 26, 2010

Similarity Preview: Kansas State vs. Butler

[NOTE: Cross posted at Upon Further Review.]

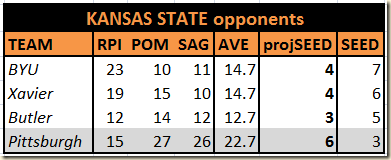
If Kansas State wins on Saturday to reach the Final Four, basketball historians will look back and think they had a relatively easy path to Indianapolis, playing no team seeded better than #5. That’s misleading, though, as BYU, Xavier, and Butler are all much better than their seeds indicate. Take a look at the RPI, Pomeroy, and Sagarin ratings for each team, along with the average of those, what seed that would entail, and what seed they actually received (I included Pitt to show that Xavier is actually better than Pitt):
image

They will have basically played three Sweet 16 games in a row, which is no tough task. Though all three teams are rated roughly equal, the game against Butler will have a very different feel. Butler is a slow-paced defensive-oriented team, while BYU and Xavier were more than happy to turn their games into offensive shootouts. If Butler can avoid turnovers – and Butler usually can, but it’s a big if when facing a KSU team whose main defensive strength is creating them – then they should be able to impose their tempo on the game. Butler’s fastest-paced game so far in the tourney was 67 possessions, in the opening round against UTEP. The Wildcats have only played 6 games all year that were that slow, going only 3-3 (compared to 26-4 in faster games). All three of those losses were to Kansas, while the wins were over Colorado, Oklahoma, and North Texas – so they haven’t beaten a good team in a slow game once this year.

On the other hand, the tempo argument can be used against Butler as well. KSU has reached at least a 70-possession pace in 2 of 3 tourney games. Butler has only played 5 games that fast all year, going 3-2 (compared to 28-2 in slower games). Their losses were to Minnesota and Georgetown, and their wins were against Youngstown St., Illinois-Chicago, and Valparaiso. So they’ve also not beaten a good team and Kansas State’s preferred tempo. My guess is that neither Butler’s nor KSU’s trend will change – whichever team gets to play their style of game will win. As you’ll see below, my system picks K-State as a large favorite, but I think it may have a blind spot here in regards to the tempo issue.

Let’s go over what the game will look like when Butler has the ball:

image

image

I think the most important category in the above two tables is TO%; you can see this is a strength vs. strength match up, with Butler being as good at avoiding them as K-State is at causing them. As I mention before, if Kansas State can win this battle, and force Butler to commit more turnovers than usual, I think they can force the pace and win this game. Another area that could be key is offensive rebounds – Butler doesn’t get many, but Kansas State doesn’t prevent them very well, either. If the Bulldogs get more second chance points than they’re accustomed to, it could be a bonus for them.

One facet of the game where it seems clear what will happen is free throws. Butler gets to the line often, and Kansas State puts their opponents there often, so expect a parade of trips to the line for Matt Howard and Ronald Nored (who have the top FTR’s on the team).

Last game, I told you that Curtis Kelly should be salivating, as Xavier was relatively weak inside, and he ended up with a line of 21 points, 8 rebounds, and 5 blocks, near his season highs of 22/11/6. Butler’s not quite as bad inside as Xavier, but they do get blocked quite often, and aren’t very tall (293rd in effective height). Expect another big game from Kelly, though perhaps not quite as good as last night.

Now how about when Kansas State has the ball:

image

image

Kansas State likes to push the ball up the court, but Butler will get everybody back to make this more difficult. That’s part of the reason Butler has such a low offensive rebounding percentage – they choose transition D over crashing the boards. If you watched the Kentucky-Cornell game, you saw one of the more dramatic examples of this that I can remember, with at times literally zero Cornell players within the three point circle when their shot hit the rim. Rebounding on Kansas State’s offensive end will be the direct opposite of this – they hit the boards hard (5th nationally in OReb%), but Butler is one of the best in the country at boxing out (13th in OReb% allowed). This is another strength-on-strength battle that will go a long way towards deciding the game.

Though it’s not shown above, Butler has been forcing a high number of turnovers during the NCAA tournament. Being careful with the ball is not a huge strength of KSU, so there’s a chance Butler can keep this new trend going.

We all know by know that free throws are on of Kansas State’s main weapons. Butler has only been middling at avoiding fouls overall this year, but have done much better during the tournament. I’m guessing this trend will end Saturday.

Putting it all together, here’s what the similarity system says:

image

Frankly, I don’t agree with this at all. Something I want to address in the offseason is that early games are weighted equally to later games (this was a problem with the Xavier prediction as well). Most of Kansas State’s advantage here is derived from some bad defensive games early in the season against (as that’s when they played the major conference teams that are similar to Kansas State). If I take out games from November and December, the similarity system changes it’s mind, and basically agrees exactly with Pomeroy:

image

That’s what my gut says as well – I expect a close, tough game with Kansas State a slight favorite.

Tuesday, March 23, 2010

Similarity Preview: Kansas State vs. Xavier

[NOTE: Cross posted at Upon Further Review.]
[NOTE 2: More problems with tables.  I apologize in advance.]

Today I’ve gone more in-depth than I expected do, as there are so many interesting factors influencing this prediction.  So I’ll spare you the BS intro and get right to the fun part.  As always, since this is a post design for UFR, I’ll assume you’re already intimately familiar with Kansas State, and the first half will focus on Xavier’s style of play.  We’ll start with Xavier’s offense.

XAVIER OFFENSE

Key Traits:

Off Eff

TO%

3P%

2P%

OReb%

 
2010

Xavier

115.8

17.8

37.4

50.4

33.7

Std Dev from Ave

1.6

1.4

1.0

0.7

0.1

SIM

Similar Teams

Off Eff

TO%

3P%

2P%

OReb%

94

2010

Villanova

116.7

18.7

37.3

50.4

37.6

93

2010

Memphis

114.8

17.0

38.8

50.6

32.5

92

2010

Mississippi

113.4

17.1

36.7

50.8

34.7

92

2010

Vanderbilt

113.7

19.2

36.9

51.5

32.2

92

2010

Virginia Commonwealth

112.3

18.2

36.7

50.4

36.3


Xavier can shoot well and doesn’t turn the ball over, but these stats indicate they're not great on the offensive boards.  One game ago I would have warned you to look past the stats, as in their 10 games leading up to round two against Pitt, they averaged an extremely high 39.4% offensive rebounding percentage (which would rank them 12th in the nation if they’d done it all year.  I thought they had put the pads on during practice, and solved their issues.  But then they came out in the last game and went back to their old ways, only grabbing 19% of their offensive misses.  If weak sauce Xavier shows up again in the Sweet 16, they’re likely finished.

One stat not listed above is Block% - Xavier gets blocked on 12% of their shots, which ranks 323rd out of 347 teams.  This plays right into Kansas State’s hands, as they block 12.8% of opponent shots, 25th best nationwide.  Curtis Kelly should be salivating.

Thursday, March 18, 2010

Final Four Characteristics

Just a short post to share something I noticed when digging through data last night…

In the Pomeroy Era (2004-09), there have been 24 Final Four teams.  All of them except 2006 George Mason and 2006 LSU fit the following critera:

  • 30th or better in Adjusted Offensive Efficiency
  • 30th or better in Adjusted Defensive Efficiency
  • 15th or better in Pythagorean Rating
  • 150th or better in defensive eFG%
  • 150th or better in offensive 2PFG%
  • 150th or better in defensive 2PFG%

Here are the teams in each region that fit these criteria:

  • EAST: Kentucky, West Virginia, Wisconsin
  • WEST: Syracuse, Kansas State, BYU
  • MIDWEST: Kansas, Ohio State
  • SOUTH:

Yes, I left the South blank on purpose.  Duke is disqualified due to their terrible shooting percentage within the arc (46.9%, 205th nationally).  However, they make up for this by being a fantastic offensive rebounding team (40%, 10th nationally), so given the lack of alternatives, I’d slot them in as the best fit in the South by these criteria.

Monday, March 15, 2010

Similarity Previews: KC-Area Teams

[NOTE: Some of this is cross posted over at Upon Further Review, a great KC-area sports blog.]

With the success of the similarity predictions so far (WARNING: extremely small sample size):

image

I figured I’d continue down this path, at least until I start to see some bad results.  I’ll be doing a comprehensive preview of the first round games that highlights the instances where the similarity prediction dovetails from the standard Pomeroy prediction, but first I’m going to tackle the match ups involving teams that are of interest to UFR readers.  Any system that pegs the KU and KSU games as anything other than huge mismatches probably involves throwing things off the Empire State Building, so I won’t spend much time on those games.  The more interesting game is Missouri-Clemson, so that’s the one I’ll start with, and focus on.


Saturday, March 13, 2010

Similarity Predictions: 3/13

Yesterday’s experiment went fine, so I’m going to post a few more of these predictions, for today’s major conference championship games – without commentary this time.

Tuesday, March 2, 2010

Similarity Scores: Title Contenders

This is part 3 (or 5, depending on if you count the posts at UFR) of the Similarity Scores series. The post on how the scores are calculated is here, in case you missed it.  Tonight I'll be taking a look at which teams from the past are most similar to the current AP Top 10, and how those teams fared in the NCAA tournament.

[Data is from games through March 1, 2008.]

The Big 12 post ended up checking in at a Posnanskian length, which is usually a bad thing for anyone other than Joe, so I'm going to keep the commentary to a minimum this time.  Also, there will be a couple changes to the lists themselves.  First, I'm only including teams that made the NCAA tournament.  If they weren't good enough to make it, they can't be THAT good of a comp.  And second, I'm adding two new columns to these graphs: NCAA seed, and PASE (Performance Against Seed Expectation).  This tells to what extent each team exceeded or fell short of expectations, relative to their seed in the big dance.

2010 Syracuse - Historical Comps
SCORE
YR
TEAM
SEED
W's
PASE
90
2009
Syracuse
3
2
0.1
88
2005
Syracuse
4
0
-1.5
88
2008
Kansas
1
6
2.6
88
2006
Kansas
4
0
-1.5
87
2005
North Carolina
1
6
2.6
87
2007
Kansas
1
3
-0.4
87
2006
Florida
3
6
4.1
86
2007
Georgetown
2
4
1.6
86
2004
Providence
5
0
-1.1
86
2008
Georgetown
2
1
-1.4


Average
2.6
2.8
0.5

Pretty all-or-nothing here - 3 champs, and 3 first round upsets.  But notice that the upsets are all 4/5 seeds, meaning they may have had good numbers, but they apparently didn't take care of business as well as this year's Orangemen.  Limit it to seeds 1 through 3, and you're looking at an average of 4 wins, and a +1.3 PASE.  Or, looking at just 1 seeds, where 'Cuse expects to end up this year, we see 5 wins and a +1.6 PASE.

Monday, March 1, 2010

Similarity Scores: Big 12

I introduced team similarity scores yesterday (summary at UFR, complete description here), and today I’ll be applying them to the Big 12.  If you’re here via UFR, you’ve already seen the lists for Kansas, Kansas State, and Missouri, so you can skip down to Texas.  Everybody else, dig in.

2010 KANSAS

2010 Kansas - Historical Comps
SCORE
YR
TEAM
NCAA W's
94
2007
Kansas
3
94
2005
Louisville
4
93
2008
Kansas
6
93
2004
Cincinnati
1
93
2004
Connecticut
6
92
2008
Memphis
5
92
2007
Texas A&M
2
92
2004
Gonzaga
1
92
2009
Gonzaga
2
92
2006
Florida
6

The 2004/9 Gonzaga teams are on this list partly because they have great raw stats from beating up on the WCC.  Ditto for 2004 Cincy, as they were in Conference USA back then.

As you'd expect, there are a couple Kansas teams on here, as Bill Self has a distinct style that he's installed in Lawrence: great interior defense with lots of steals and blocks (see 2004 UConn, 2008 Memphis) and great shooting and good rebounding on offense (see 2006 Florida, 2005 Louisville).  What may be surprising to some is that last year's 2009 Kansas not in the top 10.  That's because this year's team has improved almost literally across the board.

Also, it's nice to see 3 champions and 2 other Final Four teams on there (and 2005 North Carolina was close, at 91).  You might think any team rated this highly will automatically have a bunch of great comps, but that's not quite true.  One of the closest teams in that dataset to 2010 KU, by Pythag rating, is 2005 Duke: